Pre-hire assessment completion rates & candidate drop-off by industry
6 minute read
Posted by Emily Hill on 3 March 2026
What 200,000+ candidate journeys reveal about how hiring performance changes across sectors
Why do candidates complete nearly every assessment in some industries — but never even start them in others?
At first glance, the explanation seems obvious. Different sectors have different candidates, different expectations, or different hiring challenges.
But analysis of more than 200,000 pre-hire assessment journeys suggests something more revealing.
Across this dataset, every employer used a ThriveMap realistic job assessment, meaning differences in outcomes cannot be attributed to variation in assessment design or experience quality.
ThriveMap assessments are built to simulate the realities of the role itself — showing candidates what work actually involves before interview. This matters because most hiring assessments still focus purely on screening ability rather than helping candidates understand the job they are applying for.
Yet completion outcomes still varied dramatically by industry.
As Recruiting Brainfood analyst Hung Lee observed when reviewing the findings:
I’m not sure if we’ve ever seen sectoral segmentation on this type of data before; it’s fascinating and important to see how candidate behaviour on the assessment journey varies by industry. Important work here by Thrivemap – all recruiters should dig in.
This distinction is important. Industry differences persist even when assessment quality is controlled — suggesting that candidate behaviour is shaped less by assessment difficulty and more by how clearly candidates understand the role they are committing to.
Separate research in this report shows that fewer than 5% of organisations currently use assessments to educate candidates about the realities of the job itself. Most assessments still act purely as filters.
ThriveMap takes a different approach: using realistic job assessments to allow candidates to self-select in or out based on informed understanding.
What sectoral segmentation reveals here is not simply assessment performance — but differences in candidate commitment before the assessment even begins.
Assessment start & completion benchmarks by industry
Industry
Start Rate
Completion Rate
Drop-Off
Utilities & Energy
97.4%
99.3%
0.7%
Facilities Management & Public Services
89.4%
93.1%
6.9%
Engineering, Rail & Industrial Technology
82.9%
96.1%
3.9%
Transport & Public Transit
78.7%
91.8%
8.2%
Real Estate & Property Development
78.1%
94.8%
5.2%
Telecommunications & Technology Services
79.7%
88.8%
11.2%
Logistics & Supply Chain
76.3%
91.1%
8.9%
Financial Services & Consumer Lending
66.2%
84.2%
15.8%
Environmental Services & Waste Management
63.5%
76.5%
23.5%
Veterinary & Animal Care
50.0%
65.2%
34.8%
The most striking differences appear not in completion — but in whether candidates start assessments at all.
Utilities candidates almost universally begin the process. In veterinary and some service-adjacent sectors, half of invited candidates never enter the assessment environment.
Because the assessment itself is consistent, these differences cannot be explained by assessment quality.
They reflect something upstream.
The real divide happens before assessment
Once candidates start an assessment, completion rates converge significantly across industries.
This suggests a critical shift in interpretation:
The primary point of candidate loss is not assessment difficulty or length — it is initial commitment.
Candidates appear to make an early decision about whether a role is worth pursuing before engaging with evaluation.
The assessment does not create motivation — it clarifies commitment.
When candidates experience realistic previews of day-to-day work, they can make informed decisions earlier in the hiring journey. Those who continue are doing so with clearer expectations about the role itself.
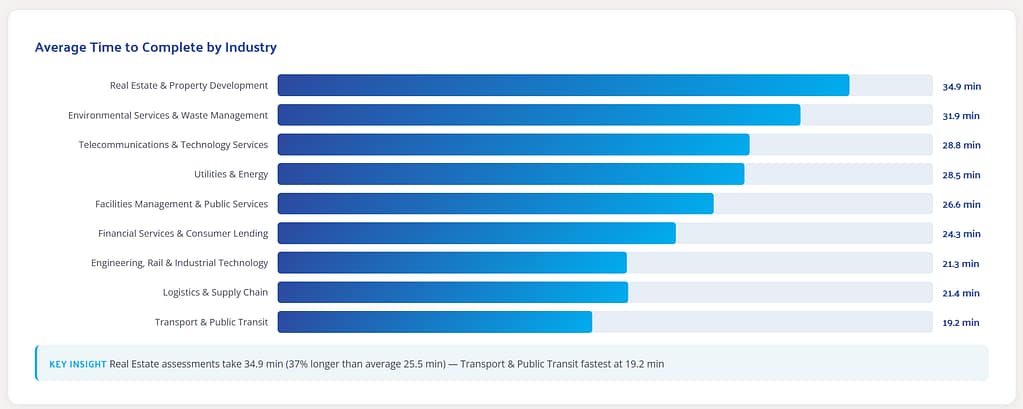
Average assessment completion time by industry
Industry
Average Time to Complete
Real Estate & Property Development
34.9 mins
Environmental Services & Waste Management
31.9 mins
Telecommunications & Technology Services
28.8 mins
Utilities & Energy
28.5 mins
Facilities Management & Public Services
26.6 mins
Financial Services & Consumer Lending
24.3 mins
Engineering, Rail & Industrial Technology
21.3 mins
Logistics & Supply Chain
21.4 mins
Transport & Public Transit
19.2 mins
Assessment duration varies by nearly 16 minutes between industries.
Longer assessments are tolerated when candidates perceive strong career value or stability. Where alternative opportunities are abundant, time becomes friction.
Assessment length, therefore, cannot be optimised in isolation — it must be calibrated against sector expectations.
This highlights an often-overlooked dynamic: candidates are willing to invest time when the assessment helps them understand what success in the role actually looks like.
Realistic assessments reduce uncertainty. Rather than asking candidates to complete abstract tests, they provide evidence of what the job involves — allowing candidates to decide whether the opportunity genuinely fits their expectations.
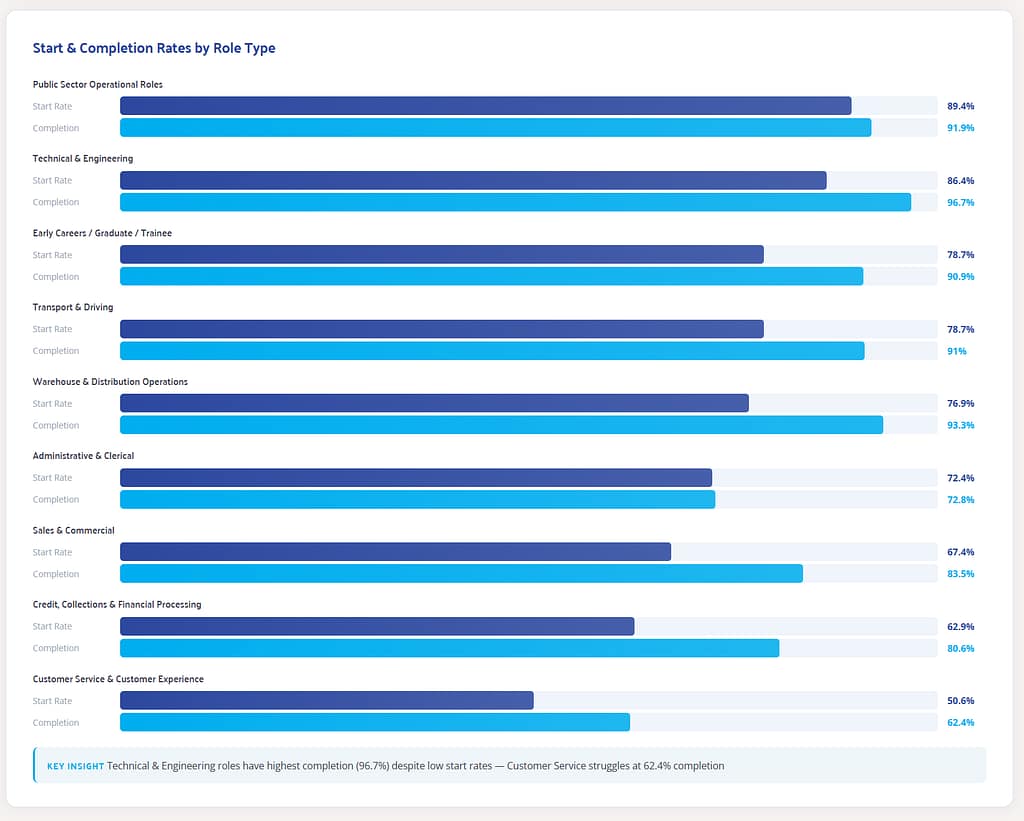
Completion behaviour by role type
Role Type
Start Rate
Completion Rate
Public Sector Operational
89.4%
91.9%
Technical & Engineering
86.4%
96.7%
Early Careers / Graduate
78.7%
90.9%
Transport & Driving
78.7%
91.0%
Warehouse & Distribution
76.9%
93.3%
Administrative & Clerical
72.4%
72.8%
Sales & Commercial
67.4%
83.5%
Credit & Financial Processing
62.9%
80.6%
Customer Service & Experience
50.6%
62.4%
Role type mirrors the same pattern seen across industries: structured or specialised roles show strong engagement once candidates enter the process, while high-volume customer-facing hiring experiences greater early disengagement.
What sector segmentation actually reveals
Because assessment experience is standardised, industry differences expose variations in how candidates apply for jobs.
Some labour markets attract deliberate applicants who research roles and expect structured selection processes.
Others attract exploratory applicants applying to multiple opportunities simultaneously, committing later — or not at all.
Sector benchmarking therefore reveals differences in applicant intent rather than assessment effectiveness.
A shift in how assessment performance should be understood
Traditionally, hiring teams evaluate assessments as if candidate engagement develops during the hiring process.
This data suggests the opposite.
Candidate commitment is largely formed before assessment interaction begins.
Pre-hire assessments function less as engagement tools and more as commitment checkpoints — identifying candidates already prepared to invest effort in the opportunity.
Preventing job catfishing in hiring
One emerging risk in modern hiring is what ThriveMap describes as job catfishing — where candidates accept roles based on incomplete or overly optimistic job information, only to discover mismatches after joining.
Traditional assessments rarely address this problem because they evaluate candidates without revealing the realities of the role.
Realistic job assessments change that dynamic by aligning expectations early, enabling informed opt-out before hire rather than regret after onboarding.
(See our analysis on job catfishing and realistic hiring previews
The bigger implication for hiring teams
Industry benchmarking remains critical, but not because sectors require fundamentally different assessments.
Instead, sector context influences candidate certainty at the point of application.
Organisations interpreting completion rates without this context risk diagnosing the wrong problem — optimising assessment design when the underlying issue may sit earlier in the hiring journey.
The emerging lesson is simple:
Candidates rarely abandon assessments at random.
Most decide whether to continue long before the first question appears.
And when hiring experiences are grounded in realistic job previews, those decisions become intentional.
The role of pre-hire assessment is shifting — from filtering candidates to helping both sides understand the work itself.
In that sense, completion rate is no longer just a hiring metric. It becomes a signal that candidates are entering roles with clearer expectations, stronger alignment, and a lower risk of mismatch.
Subscribe for insights, debunks and what amounts to a free, up-to-date recruitment toolkit.
About ThriveMap
ThriveMap creates customised assessments for high volume roles, which take candidates through an online “day in the life” experience of work in your company. Our assessments have been proven to reduce staff turnover, reduce time to hire, and improve quality of hire.
Not sure what type of assessment is right for your business? Read our guide.
Other articles you might be interested in
94% of the cost of early attrition sits outside the recruitment budget
New customer analysis has found that almost all of the financial cost of early employee turnover falls outside recruitment, with training and lost productivity accounting for more than 94% of the total cost. A UK retail and distribution business mapped every cost associated with a warehouse operative leaving within their first month as part of […]
What skills talent acquisition professionals need in 2026 and beyond
Every conversation about AI in recruitment seems to end in the same place. “AI is saving recruiters hours.” That’s great. But the more interesting question is what recruiters should actually be doing with those hours. That was one of the biggest themes coming out of RecFest UK 2026. The technology is improving at an incredible […]
The 8 priorities separating high-performing talent acquisition teams in 2026
Based on research with 200 talent acquisition leaders and analysis of more than 200,000 candidate assessment journeys. The hiring conversation in 2026 has been dominated by AI. But when ThriveMap surveyed 200 talent acquisition leaders, a more grounded picture emerged. The highest-performing teams aren’t chasing speed. They’re investing in hiring accuracy: improving quality of hire, […]